The Significance of Measuring What Matters
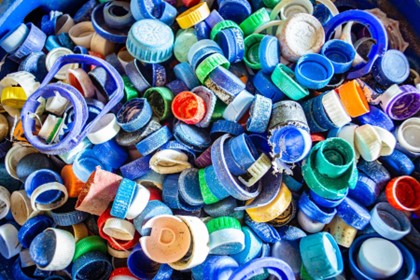
Image 1: HDPE lids collected for recycling
From the time immemorial, quantification has been an important pillar for the effectiveness of important activities like agriculture, trade, and construction. In the modern times, even though the tools and methods of measurement have evolved, its importance remains the same. Improved socioeconomics of the world population have drastically increased material consumption of people across all continents. However, concerns associated with certain materials like plastic is not alien to anybody. Accordingly, quantitative assessment finds a crucial place in the effort to induce circularity in the plastic value chain. Under the ‘India-Australia Industry and Research Collaboration for Reducing Plastic Waste’, institutes from both countries have come together to achieve this much desirable goal of making the plastic economy more sustainable.
Table 1: Share of plastic consumption in major end-use sectors
Quantification followed by documentation enables information sharing, which improves communication and eases collaboration among teams. In the current project, six teams periodically share quantitative updates of their own work with one another to have holistic understanding about the progress of the combined project.
Measuring is critical in so many ways and at almost all steps of a project. The first step of solving any problem at hand is quantification of the problem. Existing numbers from the Organisation for Economic Co-operation and Development (OECD) state that 300 million tonnes (Mt) of plastic are produced every year out of which only 9% is recycled, majority of it is landfilled, some portion incinerated, and 22% mismanaged and thus leaks into the natural ecosystems including land and ocean (OECD, 2022). Even though plastic is a recyclable material, most of the plastic in use today is virgin or primary, that is, made from crude oil or gas. Global production of plastic from secondary materials has quadrupled from 6.8 Mt in 2000 to 29.1 Mt in 2019, but it still constitutes only 6% of the total plastic production.
Considering the humongous problem that it is, without a systematic direction and approach, sustainability personnels cannot achieve their goal of circular plastic economy. It is going to be an ambitious road ahead. Reducing pollution from plastic will require local action and international cooperation through innovation, better product design, and developing environment-friendly alternatives, as well as efforts to improve waste management and increase recycling.
Both India and Australia are committed to take actions to reduce plastic waste by driving innovation and enabling new technologies and business models to achieve this. In the current project, we are measuring the number of polymers in the economy, which includes whole polymer products and polymer-laden products. Identifying these polymer flows across different sectors correctly is a prerequisite for drawing out the approach to the solution. These products include those produced in India as well as those traded. Plastic represents the 6th largest imported product and the 15th largest exported product in India (WITS, 2018). Measuring additional parameters like trade partners, processing method, polymer applications, and sector-wise presence is also necessary to ultimately decide upon the current impact of plastic on environment and economic feasibility of making several sustainable transitions, such as choosing substitute materials.
Due to favourable characteristics of plastics such as light weight, durability, and cheap cost, its consumption has significantly increased across all sectors of the Indian economy. Between 2011 and 2019, the apparent consumption (import + domestic production – exports) of major commodity plastics has increased from 9.41 Mt to 15.99 Mt with an estimated compounded annual growth rate of 6.9%. The share of polymers consumed in different end-use sector products suggests that the packaging sector dominates the plastic consumption in India (59% share including flexible and rigid packaging). The building and construction sector has 13% share followed by agriculture at 9%. Table 1 depicts the change in plastic consumption in end-use sectors over a period of 7 years.
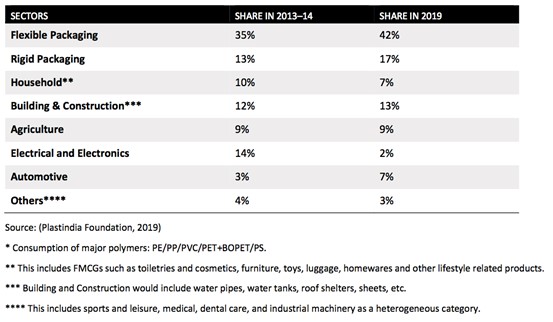
From Table 1, it is evident that the maximum growth is seen in the packaging sector, largely contributed by flexible packaging. It is anticipated that there will be further strong growth in future due to numerous advantages of flexible packaging, such as its light weight and small size that result in the convenience in its handling and disposal, price advantage in transportation, and energy savings, which has traditionally been limited by rigid packaging. While consumption has remained stable in sectors like building and construction and agriculture, it has dropped in the electricals and electronics equipment (EEE) and household sectors. Rising awareness among consumers could be a reason for reduced plastic consumption in households that includes fast-moving consumer goods, toys, and other life style products. The significant fall in consumption of polymers in the EEE sector between 2013-14 and 2019 could be partly due to changing accounting practices for packaging of plastics in the sector and partly due to emphasis in the EEE sector on aspects of circularity such as reuse, remanufacture, and repair. Quantification of such information helps targeted intervention in different end-use sectors and makes the aim of circularity much easier and feasible.
Quantification of end-of-life flows is equally important as different plastic products have different lifetimes. Short lifetime plastic products (mean average lifetime of up to a year) may end up in the waste stream within a year. For long lifetime plastic products, the mean lifetime varies from 3 years for consumer and institutional products to as high as 35 years for building and construction products. Apart from natural damage, the type of usage, quality of manufacture, and redundancy in design are other factors that, if quantitatively assessed, can help to get a true picture of the present rate of circularity in plastic economy and steps needed for future.
In the current project, different end-of-life management practices such as incineration, landfill, and recycling are considered. India has one of the highest recycling rates for plastic but most of plastic recycling is done by the informal sector and that often involves down-cycling to produce low-quality recyclates. This poses a data gap for the future scaling of the project as well as quantification of low-value plastic products that cater to the poorer section of Indian society.
Despite existing data gaps and assumptions, the sector-wise polymer flow that is drawn out has given valuable insights about the status of plastic economy in India and also helped to prepare for shocks like the COVID-19 pandemic and to an extent predict its aftermath. Important information for the future, such as polymer consumption elasticities, sector-wise demand, policy influence like the impact of Plastic Waste Management Rules 2021 and incorporation of extended produced responsibility under it, will be smoother with such data being available.
References
-
Organisation for Economic Co-operation and Development (OECD). 2022. Plastic pollution is growing relentlessly as waste management and recycling fall short, says OECD. Details available at https://www.oecd.org/environment/plastic-pollution-is-growing-relentlessly-as-waste-management-and-recycling-fall-short.htm, last accessed on 8 June, 2022
- World Integrated Trade Solution (WITS). 2018. India trade data. Details available at https://wits.worldbank.org/CountrySnapshot/en/IND, last accessed on 26 June, 2022
Trinayana Kaushik1
t.kaushik@teri.res.in
Tim Baynes2
Tim.Baynes@csiro.au
Affiliations:
1The Energy and Resources Institute, India
2Commonwealth Scientific and Industrial Research Organisation, Australia