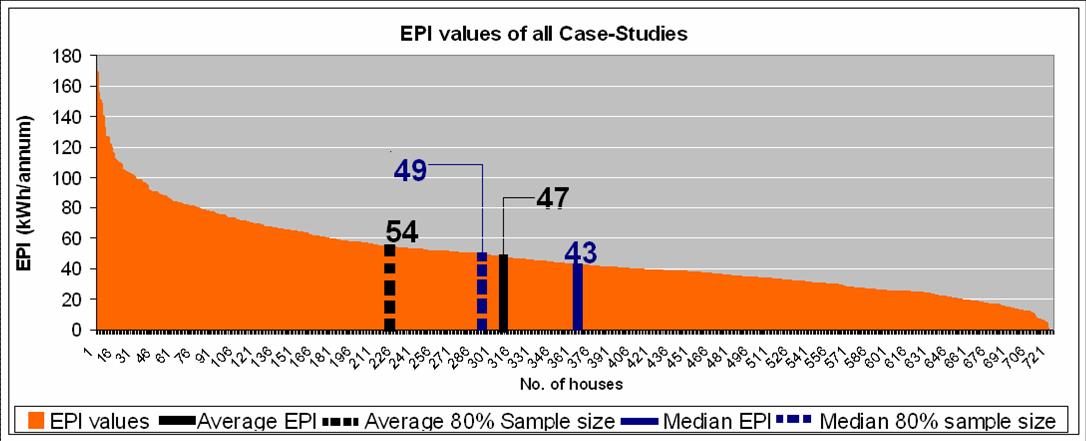
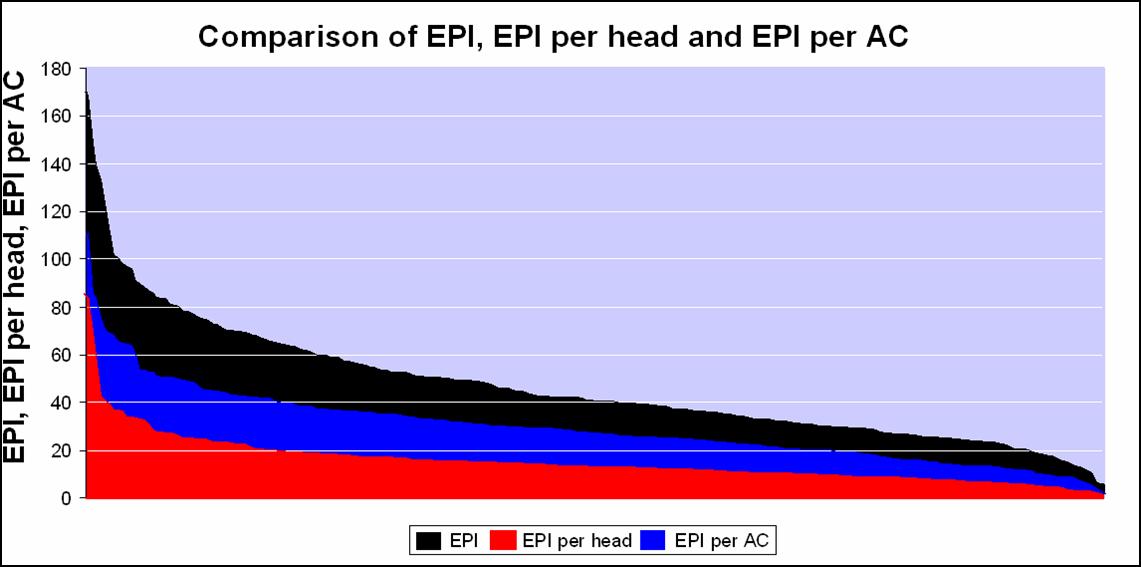
| Building Energy Efficiency Through T he building sector - residential and commercial - consumes around 37 per cent of the electricity generated in India and offers a massive opportunity for a much more efficient use of energy. More importantly, energy efficiency can result in the overall improvement in the quality of buildings, especially, if their design is climate-responsive, as per the five climatic zones of India – hot-dry, warm-humid, composite, temperate and cold. The Bureau of Energy Efficiency (BEE), set up in 2002, has a mission of reducing the energy intensity of the Indian economy by developing the right mix of policies and strategies. Having launched an Energy Labelling Programme for electrical appliances, it has recently developed an Energy Conservation Building Code (ECBC), which lays down minimum energy efficiency standards for design and construction of commercial buildings. Along similar lines, the residential building sector, which is characterised by large volumes of housing being developed by private builders and contractors, needs a set of enabling tools and methods to become energy efficient. The key players in this sector are largely unaware of the long-term benefits and the relevant knowledge support needed for energy efficient buildings.The Swiss Agency for Development Co-operation (SDC) is supporting an initiative to build capacities and knowledge of private sector stakeholders, in the area of building energy efficiency in India - for the overall strengthening of the BEE mandate. The project facilitator in India is Greentech Knowledge Solutions Private Limited in New Delhi. The TARA Nirman Kendra (TNK), a building centre of The Development Alternatives Group, is involved in the selected components of the project related to knowledge support for key stakeholders and guidelines for design and construction of energy-efficient residential buildings. The study estimates average electricity consumption of around 80 kWh/m2/annum and 160 kWh/m2/annum for residential and commercial buildings respectively. According to the Construction Industry Development Council of India, the gross built-up area in India increased by approximately 41 million square metres in 2005-06 and is growing at an annual rate of 10 per cent. Thus, under the ‘business-as-usual’ scenario and based on a 10 per cent annual increase in the new built-up area, the projected annual increase in electricity demand in residential buildings would be 1,694 MWh. Energy Performance Index The electricity bills for three residential housing schemes have been collected and analysed for an average Energy Performance Index (EPI) value. This value signifies the level of energy consumption in two types of residential buildings - multi-story apartment and low-rise for middle-income families of two to six members. The value indicates the level of energy consumption of the section of the urban population that is considered in the study. Air-conditioning has the maximum influence on EPI because, irrespective of the number of occupants, the EPI of two AC households remains consistently higher than single AC houses. The number of occupants influences EPI to a much lesser degree. Types of residential buildings The multi-story apartment buildings with 7-10 floors and low-rise apartment buildings of up to four floors are the most common type of residential buildings being developed in the urban and peri-urban areas in India. While the former is generally developed by private builders, the latter is provided by the government. However, low rise independent access apartments are also being developed in the suburban areas, where the permissible Floor Area Ratio (FAR) limits do not allow for high rise construction. The total built-up area of a typical apartment of this type is in the range of 85 to 130 m2. Typically, these apartments have three bedrooms with attached toilets and dining/drawing areas located centrally, with around 8-10 per cent of the built-up area in the form of semi-covered balconies. The envelope of these buildings is normally made up of plastered brick masonry walls and RCC roofs with terracing. The typical U-values of walls, roof and windows are 2, 2.3 and 5.8 W/m2K. The window to wall and window to floor ratios are in the range of 25-30 per cent and 30 per cent respectively. The windows are mostly single glazed with 1 to 1.5 deep overhangs as shading devices. The surface area to volume ratio ranges from 2.5 to 3.5. Generally, the layout of a typical apartment building allows for at least 30 per cent of the exposed-wall surface to be shaded through wall sharing and self shading. Apart from shading considerations, although not optimised for effectiveness, there are no specific measures for energy efficiency, which can be seen in conventional design and construction of residential buildings. Energy Performance Given the above type of design and construction, the following conclusions can be drawn about the EPI of the residential buildings: • The average EPI of residences lies in the range of 45 to 50 at 47 kWh/ m2/ annum - This represents varying levels of energy consumption, ranging from below 10 to above 100. As such, it covers a large range of both the level of occupancy and lifestyle of occupants, which dictates the operation of electrical appliances. • For a more specific and targeted approach towards improving the energy performance, it is important to look at the levels of energy consumption in households, which fall in a tighter range of EPI – this should at least contain 80 per cent of the total households. For this sample, the lower 20 per cent households – which have an EPI in the 0-30 range - can be excluded as it is highly probable that they will shift to higher levels of energy consumption in future. The average EPI of residences which are top 80 per cent of the energy consumers in a given sample of residences, lies in the range of 50 to 55 at 54 kWh/ m2/ annum. • The range of EPI with the highest probability is 30 to 60 kWh/ m2/ annum - Two thirds of houses in this range are likely to have 2-4 occupants and there are equal number of houses with one and two air conditioners. • There is an emerging trend of households with EPI above 80 kWh/ m2/ annum which are houses with two or more air conditioners and four or more occupants. This group is likely to enlarge substantially in coming years as income levels and rate of urbanisation increases which is inevitable. Many households currently in the 30-60 EPI category will shift to this higher bracket in keeping with the perception of ‘higher appliance usage (particularly for space cooling) for greater degree of indoor environmental comfort throughout the year. • In a given sample of houses, there are at least 5 per cent of houses with sub-optimal conditions of occupancy leading to EPI below 10. • A certain measure of redundancy in space usage sets in once the built-up area exceeds a limit. This limit is likely to be in the 130-140 m2 range, as shown in the case of HEWO apartments where the small bedroom of 12 m2 area is used either as a guest room or a store. This happens especially in case of households with 2-4 occupants. As a result, the EPI of houses in this area range decreases by 15 to 20 per cent to between 35 and 40 kWh/ m2/ annum. • The energy performance of households with different predominant is reasonably identical. As per the prevailing designs and more importantly, from the commercial viewpoint of optimal utilisation of the available FAR, each house, particularly in the multi-story buildings, is exposed on at least three orientations. The energy performance is largely governed by factors of lifestyle and occupancy. At the same time, it is also not possible to examine in greater depth, the effects of orientation on indoor energy performance, simply based on data of electrical energy consumption. Real time monitoring of indoor environmental conditions is needed to study potential benefits of orientation with certainty. • EPI tends to be 10-15 per cent higher in top floor houses as compared to ground floor houses. The high end values of EPI above 80 are witnessed almost twice as much in top-floor houses as compared to lower-floor houses, irrespective of different levels of occupancy and air-conditioning. This is also corroborated by the energy simulation (as explained in the previous section) of HEWO Towers where the highest EPI (12 kWh/m2/year) for air conditioner among the entire floors could be seen in the top floor. This could be attributed to higher conductive heat gain through roof. • The EPI per occupant lies in the range of 5-20 kWh/m2/year with the average value being 15 kWh/m2/year. This is the range in which nearly 75 per cent of ‘EPI per head’ values for all three case studies lie. Two thirds of households with 2-4 occupants have EPI per occupant in the range of 10-20 • Air conditioning is the most critical factor for the ultimate energy consumption of the household. The EPI per occupant lies in the range of 10-40 kWh/m2/year with the average value being 15 kWh/m2/year. Irrespective of the number of occupants, the EPI of a two-AC household remains consistently higher than a single-AC house. Almost 75 per cent of the houses have an EPI above 20. On comparing the EPI of houses with one, two, and three air-conditioners, it can be seen that on an average, the EPI of two-AC households is 25 per cent more than single AC ones. Almost 90 per cent of three-AC households have an EPI of more than 40 as compared to 32 per cent and 65 per cent in case of single-AC and double AC households. • As the number of air-conditioners in the household increase, the energy consumption is almost single-handedly determined by the energy requirement of the ACs. In case of single-AC households, the energy consumption for air conditioning is comparable to that of lighting and electrical appliances. Hence improvisation through passive architectural design will have lesser influence on further reduction of the energy consumption. In case of two or more ACs in the household, the contribution of energy consumption of air conditioning is found to be four to seven times more than the combined energy requirement for lighting and electrical appliances. The average EPI of single AC, two-person households increases by at least 20 per cent in double AC, four-occupant households and nearly by 70 per cent in case of households with three ACs and three or more occupants. • Almost 75 per cent households in residential buildings have an occupancy of two to four occupants, which have an EPI per head in the range of 10-20 kWh/m2/annum. This reinforces the earlier conclusion that there is maximum probability of the EPI of residences being in the range of 30-60 kWh/m2/year. Appliance usage • Space cooling is the biggest consumer of electricity. As per the analysis based on occupants recall (in the household survey), in three-end uses for space cooling, lighting and space heating, space cooling accounts for at least 90 per cent with space heating being negligible. • Among energy efficient appliances, a compact fluorescent lamp (CFL) is commonly used in almost 90 per cent households. It is used as a lighting source for utility areas and as a supplementary lighting source in dining/drawing areas or bedrooms. The BEE-energy rated refrigerators were also found in 10 per cent of the households surveyed. • Lighting Power Density in common areas like drawing/dining is in the range of 3-6 W/m2 and 5-7 W/m2 in the case of bedrooms. • AC tonnage ratio – The average ratio of AC tonnage to floor area observed in the three case studies was 0.028 T/m2 (for an area of 112.4 m2), 0.022 T/m2 (for an area of 87.5sq.m), and 0.018 (for an area of 130 m2). The last case is the HEWO Towers case, where 12m2 space is redundant in majority of the houses. Monthly Consumption • There is maximum consumption of electricity during the months of April to September – at least 65 per cent of the total annual consumption. June-July is the peak period with the monthly consumption exceeding 600 kWh. Consumption in August is also almost similar, primarily because of high humidity in the month even though the dry-bulb temperatures are lower than the preceding summer months. March and November have similar electrical energy consumption in the rage of 200-250 kWh, which is the lowest in the year. • December and January are the two months of predominant heating. The consumption in these months varies from 200-400 kWh. Way Forward According to the current study, the levels of energy consumption in households and their relationship to various factors have been established. Following are envisaged as the next steps in accordance with the overall objective of the requisite knowledge support for energy efficient buildings. • A stakeholder consultation to review the findings of the study and deliberate upon key areas to be addressed in developing design guidelines for energy-efficient residential buildings. This will involve Swiss design and materials experts, as well as a group of Indian stakeholders – private builders, urban local bodies, research institutions (sustainable buildings) and architects. • A more in-depth study of selective aspects of energy consumption through real-time monitoring of appliance usage in the households. This will be done, especially with respect to cooling energy and to investigate the effects of parameters like orientation of buildings. • A similar exercise for baseline scenario will be carried out in the context of ‘Hot and Humid’ climate by a team based in its geographical area. • Design guidelines will be developed to create the requisite knowledge support for energy efficient residential buildings. These guidelines will also be supported by a simple software facilitating the use of the guidelines to aid decision making for energy efficiency measures. • The guidelines will be pilot-tested on real building projects planned to be implemented by private builders/developers. This will take place through ‘design charettes’ organised for intensive interaction with their design teams, with the objective of incorporating measures for energy-efficiency within the framework of economic feasibility of the project. q Aakash Bagchi
|
 kWh/m2/year.