|
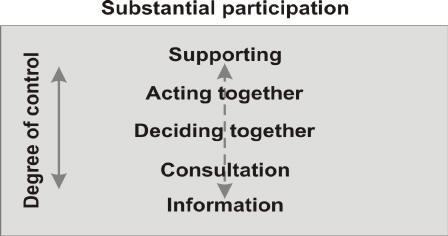
Participatory Methods for Community Participation Community participation is the process by which individuals and families assume responsibility for their own development as also those of the community, and develop the capacity to contribute to their own as well as the community’s development. People come to understand their own situation better and are motivated to solve their common problems. This enables them to become agents of their own development instead of remaining passive beneficiaries of development aid. It is a process of forming interactive partnerships with the community in the spirit of mutual growth and development, through sharing of resources, skills and knowledge. Levels of participation There are different levels of community participation from the practitioners’ perspective. It can be summarized as: l Information: merely letting the people know of the plans l Consultation: offering options and alternatives, listening to feedback, but not allowing new ideas
l Deciding together: encouraging additional options and ideas, and providing opportunities for joint decision-making l Acting together: not only do different interest groups decide together on what is best, they also form a partnership to carry this out l Supporting independent community interests: local groups or organizations are offered funds, advice or other support to develop their own agendas within the stipulated guidelines.
Participatory techniques aim to ‘break the silence’ of the disadvantaged sections, recognize the value of popular collective knowledge and wisdom and legitimize the production of knowledge by the people themselves. Participatory approaches seek to be catalysts enabling and empowering the people. Initially, the term Participatory Rural Appraisal (PRA) was used but, more recently, the term Participatory Learning and Action (PLA) is preferred as it emphasizes the importance of: l changing from appraisal to learning and, hence, moving away from the use of participatory methods as an extractive process by outsiders to a sustainable learning process involving different stakeholders as equal partners. l the importance of relating learning to action, and incorporating programme and policy improvement as an integral part of the learning process. Participatory Techniques The participatory method uses a combination of visual techniques, group and team dynamics methods and complimentary qualitative and quantitative methods of investigation. They can be summarized as: Visual techniques l Diagrams: flow/causal diagram, Venn/institutional diagram, pie charts, histograms l Ranking techniques: preference ranking and scoring, wealth ranking, well-being ranking l Time trend analysis: historical mapping, time trends l Mapping techniques: mobility mapping, social mapping, transect walks l Calendars: seasonal calendars, historical calendars Group and team dynamics methods l Focused group discussions l Role play l Participatory workshops Complimentary qualitative and quantitative methods of investigation l Secondary data review l Structured questionnaires l Semi-structured interviewing l Case studies l Participant observation Some of the commonly used participatory techniques are described as under: 1. Diagrams A diagram presents information in a readily understood visual form and has a dual use. First, the act of constructing a diagram is in itself an analytical procedure, which enables those preparing it to clearly understand the dynamics they are trying to record. Second, the diagram becomes a tool of communication and discussion among different people. l Map: A map is very useful for creating an alternative database for the design of village plans by the local people. People can draw maps of their village and locate the services, facilities and infrastructure according to availability and access to different groups, thus facilitating the identification of needs, problems and solutions. Different village groups can draw different maps to depict their perceptions, problems and needs. A number of maps by all the sections of a village can help in prioritizing and preparing the rural action plans. People in a village can draw maps on the ground, floor or on paper. Social, demographic, health and natural resources or farm maps can be drawn to construct three-dimensional models of village land. The part to be played by the decentralized development actors in this exercise is that of patient listening and motivating the people to participate by accepting and respecting their knowledge. l Transect: Transects can be used to substantiate and support a map. A transect is a systematic walk with villagers through the village, observing, listening to the villagers’ descriptions, asking relevant questions, discussing various ideas, identifying different zones, local technologies, introduced technologies, seeking problems, solutions and, finally, diagramming/mapping the transect walk and its findings. This helps to: i. build rapport with the local people ii. substantiate and support the diagrammed facts iii. identify locations of the problems and opportunities for development. 2. Seasonal mapping or seasonal calendar Seasonal mapping is an extended
version of the crop calendar representing
3. Other diagrams dealing with time trends Long-term changes in rural areas can be represented in diagrams such as historical profiles and graphic time trends. The local people’s accounts of the past, of how things close to them have changed - ecological histories, land use and cropping patterns, customs and practices, trends in fuel use, etc. - can be represented with approximate dates before and after well-known events. Although secondary data may be available on these issues, a local perspective facilitates the design of development initiatives. Another useful tool is the historical transect. That depicts local knowledge of the state of natural resources over a period of time. This can be initiated for various sectors of the rural economy to produce a series of diagrams reflecting people’s perceptions and priorities. 4. Venn diagram A Venn diagram shows the relationship between individuals, groups and institutions in a community as perceived by the people. It is made up of touching or overlapping circles of various sizes, each circle representing an individual or an institution. The size of the circle indicates their importance and the overlap indicates the degree of contact or inclusion in decision making. This helps in the formulation and implementation of development initiatives at the local level, as well as in identifying marginalized individuals/groups in the community. 5. Focus Group Discussion A Focus Group Discussion (FGD) is a group discussion of approximately 6 - 12 persons guided by a facilitator, where the group members talk freely and spontaneously on a certain topic. A FGD is a qualitative method. Its purpose is to obtain in-depth information on concepts, perceptions and the specific ideas of a group. A FGD aims to be more than a question-answer interaction. The idea is that group members should discuss the topic among themselves, guided by the facilitator. Conclusion Deploying participatory methods leads to ensuring community participation, resulting in high degrees of ownership and control by the community over social development interventions. The process results in a shift from communities being tagged as beneficiaries to stakeholders in developmental processes. There have been enormous successes as a result of inclusion of participatory methods by development professionals, resulting in the sustainability of interventions. Participatory techniques can be deployed for planning, implementation, monitoring, evaluation and influencing policies for an array of developmental themes and issues. q
|
 Participatory
methods are a diverse and flexible set of techniques for visual
representation and stakeholder involvement, characterized by a set of
underlying ethical principles. There is no one specific set of
techniques to be mechanically applied in all the contexts for all the
participants. There is on the one hand, a set of visual tools to be
flexibly applied to assist the synthesis and analysis of information
that can be used in group settings and also as part of individual
interviews. On the other hand are a set of guidelines for facilitating
participation and negotiation in focus group discussions and workshops,
bringing together different stakeholders. These gatherings may or may
not make substantial use of visual techniques. Generally, both visual
techniques and participatory facilitation are combined in different
ways. The emphasis is on innovation and creativity in adapting a
previously existing practice to new contexts and needs.
Participatory
methods are a diverse and flexible set of techniques for visual
representation and stakeholder involvement, characterized by a set of
underlying ethical principles. There is no one specific set of
techniques to be mechanically applied in all the contexts for all the
participants. There is on the one hand, a set of visual tools to be
flexibly applied to assist the synthesis and analysis of information
that can be used in group settings and also as part of individual
interviews. On the other hand are a set of guidelines for facilitating
participation and negotiation in focus group discussions and workshops,
bringing together different stakeholders. These gatherings may or may
not make substantial use of visual techniques. Generally, both visual
techniques and participatory facilitation are combined in different
ways. The emphasis is on innovation and creativity in adapting a
previously existing practice to new contexts and needs.  all
the major changes within the rural year such as rainfall patterns and
other major climatic changes, cropping, livestock cycles, labour demand,
etc. This helps in identifying lean periods for resources and in timing
the supply of farm inputs and alternative employment initiatives. Many
participatory approaches have been used in India for this purpose;
either the locally known Hindu calendar months or even festivals and
fairs. People in the Indian countryside are more familiar, comfortable
and accurate with these benchmarks than the Western calendar. Seasons
and months can be related to common and popular festivals that are
generally celebrated by the majority of the local population. The
facilitator can then convert the same as per the Western calendar.
all
the major changes within the rural year such as rainfall patterns and
other major climatic changes, cropping, livestock cycles, labour demand,
etc. This helps in identifying lean periods for resources and in timing
the supply of farm inputs and alternative employment initiatives. Many
participatory approaches have been used in India for this purpose;
either the locally known Hindu calendar months or even festivals and
fairs. People in the Indian countryside are more familiar, comfortable
and accurate with these benchmarks than the Western calendar. Seasons
and months can be related to common and popular festivals that are
generally celebrated by the majority of the local population. The
facilitator can then convert the same as per the Western calendar.