|
Water Quality mapping
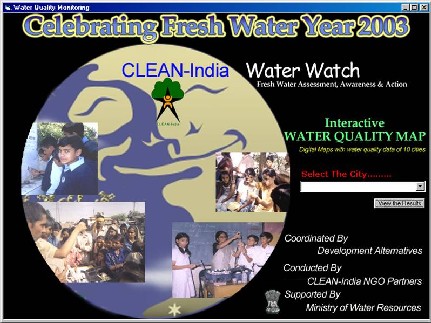
Using GIS O n the occasion of the Fresh Water Year 2003, Ministry of Water Resources sanctioned CLEAN–India Water Watch Project for three months from October 2003 – December 2003. Community Led Environment Action Network (CLEAN–India) is an environment Assessment, Awareness and Action programme of Development Alternatives.The Water Watch
project is being conducted in Amreli,
Aurangabad, Udaipur, Bangalore, Pondicherry,
Madurai, The objective of the project is to create awareness among students and communities regarding the threat to our fresh water resources and urgent need to conserve it. One of the important components of the project was to prepare the water quality maps for the 10 cities. Various activities were
undertaken as a part of the project like providing scientific skills
to students on testing the quality of drinking water, generating
awareness, and suggesting remedial measures. Beginning from water
quality monitoring to activities like tap water harvesting were
carried out as a part of the project. Assessment of fresh water
quality Students and teachers from each school were asked to identify five locations for water monitoring around their schools. Each school then identified exact sampling location at different areas of interest like residential areas, slums, industrial areas and public places. Drinking water quality from different sources like municipal supply, ground water from hand pumps, wells and bore wells were monitored. Samples were collected after taking necessary precautions and analysed. The tests results were recorded in a Monitoring data record sheet which indicates the actual reading as against the permissible / desirable limits. The chemical tests provided ample data regarding potability of water and could directly point to the existence of organic pollution, if any. The bacteriological tests gave confirmatory evidence of faecal contamination of water. The data was integrated and projected through the maps. Two sets of water monitoring, one in October 2003 and the next in December 2003 was conducted Tool Used for monitoring
Water quality monitoring is carried
out by Jal TARA Kit, developed by research scientists of Development
Alternatives. It tests GIS as a Decision Support System tool Contamination of drinking water has become a major challenge to the Environmentalist in the rapid developing countries. As more and more people are exposed to contamination of drinking water, many issues arise that not only involve premeditating the contaminated water, but also preventing similar situations from occurring in future. The drinking water is contaminated through the pipe distribution system or directly through ground water. Mapping the water quality parameters using the Decision Support system like GIS, can be useful for taking quick decisions as graphical representation would be easy to facilitate policy makers in taking a decision. A spatial Decision Support System (SDSS) is a computer –based system designed to assist the decision system. Typically, such a system will include spatial data relevant to the decision, analytical tools to process the data in ways meaningful for decision makers, and output or display functions. Geographical Information System (GIS) is an information system that is specially designed for handling spatial (or geographical) data. GIS has the advantage of handling attribute data in conjunction with spatial features, which was totally impossible with manual cartographic analysis. It combines a set of interrelated software components that create, edit, manipulate, analyse and display data both in text and graphic forms.
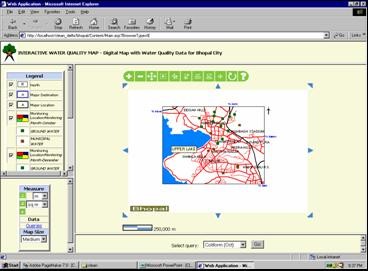
Overall Approach Interactive geo-spatial website on water quality - Capability Showcased The publishing of geo-spatial database on the web will facilitate easy monitoring of water quality parameters. The interactive website on water quality maps is very user friendly, with all the tools and techniques required for displaying and projecting the spatial and attribute data. Some of the inbuilt queries help the user to identify the problematic areas i.e. areas where drinking water is contaminated with coliform, fluoride, nitrate etc. Following are the capabilities which the website will provide:
|
||||||||||||||||||||
 Ranikhet, Indore, Bhopal and Varanasi.
Water Scarcity, geographical terrain, over-exploitation of urban
water, contamination of rivers flowing through the city, and
requirement of water harvesting were some of the criteria followed
for selection of these cities. The project is being
coordinated with like – minded local NGOs in these respective
cities. Six schools are involved in each city.
Ranikhet, Indore, Bhopal and Varanasi.
Water Scarcity, geographical terrain, over-exploitation of urban
water, contamination of rivers flowing through the city, and
requirement of water harvesting were some of the criteria followed
for selection of these cities. The project is being
coordinated with like – minded local NGOs in these respective
cities. Six schools are involved in each city. 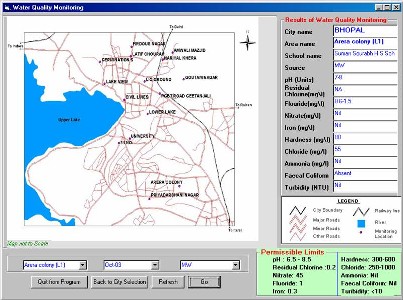
 14 parameters – temperature, pH, turbidity,
hardness, fluoride, nitrate, iron, chloride, residual chlorine,
ammonia, phosphate, dissolved oxygen, benthos and coliform bacteria.
14 parameters – temperature, pH, turbidity,
hardness, fluoride, nitrate, iron, chloride, residual chlorine,
ammonia, phosphate, dissolved oxygen, benthos and coliform bacteria.